
Many tutorials can be found for the Flying-Fish MQ9 sensor boards however the information found online is a bit fishy. Apparently many of those tutorials are copied from each other and I believe some parts of the explanation is missing. The goal of this post is to provide an explanation of how to get a (close to) real gas concentrate measurement. This tutorial can be used with any device that accepts MQ9 sensor boards like arduino, esp8266, esp32 etc..
Before continuing let’s note: this sensor is just for fun. Never use this sensor as an input for an application that is intended to protect anyone’s life. Always use certified gas detectors that are checked periodically!
MQ9 Sensor Overview
The MQ9 sensor is a part of the MQ sensor family that can detect various gases. The MQ9 sensor is sensitive to CO gas and combustible gas and the resistance of the sensor is a function of the gas concentrate. So at the end of the day we need to measure resistance. If you would like to read more about the signal conditioning related to resistance measurement please visit the general section about Signal Conditioning.
The MQ9 sensor also needs a power supply for an internal heating element because the material that detects the gas needs to be heated. The additional circuit on the sensor boards feature a comparator (LM393) and a potentiometer. With the potentiometer an additional voltage level can be set that acts like a threshold and if the measurement is beyond the set voltage the digital output pin becomes high. This is useful if you have a simple device that cannot measure voltage.
The board circuit is not too complicated, here is the important part for us. I have skipped some capacitors that are filtering and also the comparator related things.
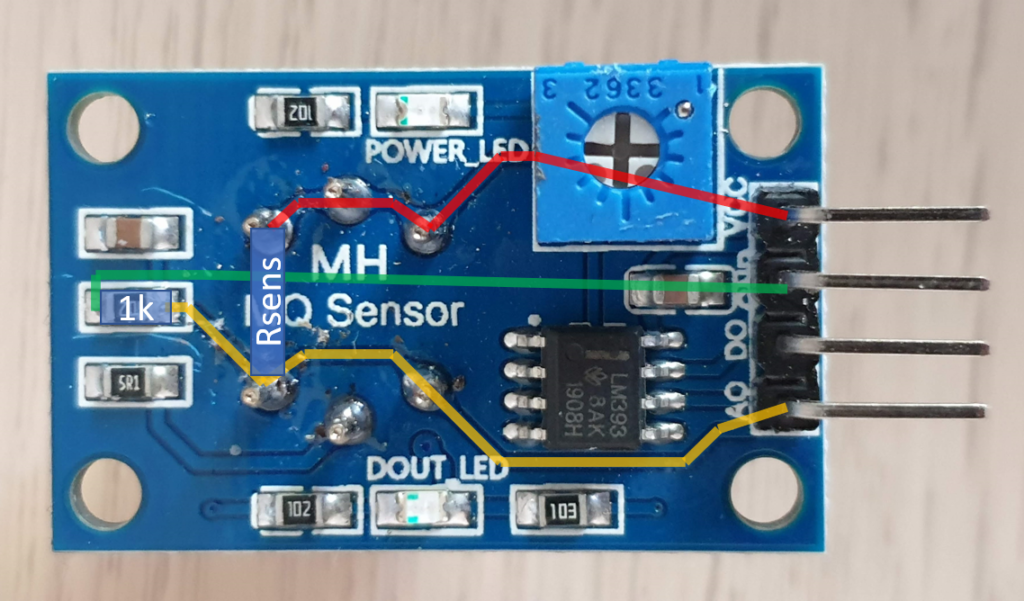

Moving around components in the layout it becomes obvious that we are looking at a simple voltage divider. The text on the resistor was not readable thus I measured it and it is 1k Ohm.
The AO (Analog Output) pin on the sensor board is connected to the inner point of the voltage divider.
The ESP8266 board I used measures voltage between the A0 and Gnd pins so we are measuring the voltage drop on the 1k Ohm resistor.
Measurement
Calculating the resistance of the sensor is not too difficult as this is a voltage divider. Let us have: U: U supply (5V), Um = U measured, Rl = Load resistance (1k Ohm), Rs = Sensor resistance (this is the function of the gas concentrate)
Using these variables the formula that describes the resistance of the sensor is: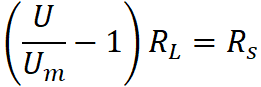 So measuring the sensor resistance is fairly easy using this formula. To be precise I measured the Load resistance, so the 1k Ohm is in fact 996 Ohm. (At this point I was still optimistic about measurement precision, see later..)
To get the Measured Voltage I used the analogRead() with my ESP8266 and got 108 To get the actual voltage we need to scale this value with FullScale/Resolution so in other words with the “LSB”. 5/1024*108=0.5273 is the measured voltage in Volts. More details about this topic in Data Acquisition.
Filling in the formula with the data above gives us: (5/0.5273-1)*996 = 8448.34 So the measured resistance of the sensor is 8448.34 Ohms and it sound realistic as according to the datasheet the operational range is 2k..20k Ohms.
To get a feeling of how this sensor works I used my KEECO ESP8266 FW to publish the measurements over MQTT and used the Quaxo LabVIEW MQTT add-on and some custom code to visualize the data. The blue graph is the raw data, the red graph is a fitted linear curve. 500 seconds of data is visualized here:
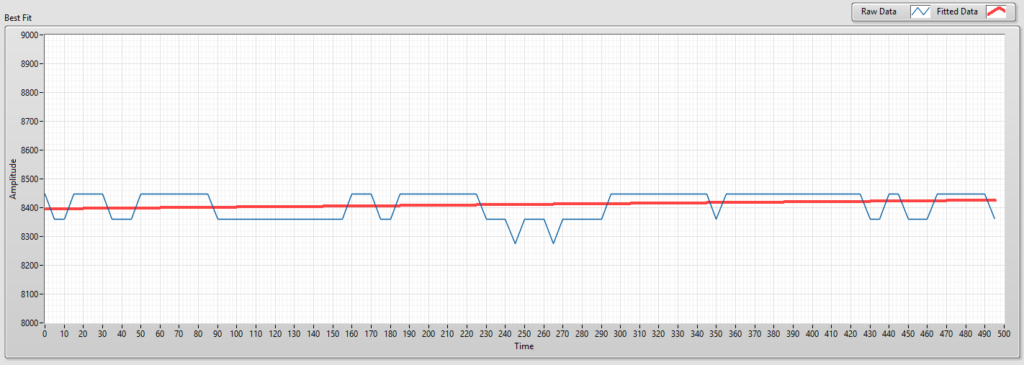
Please note that the normal range is 2..20k Ohms so the measurement looks much smoother, I just zoomed in to see how it goes. The MQ9 sensor needs 48 hours while it completely heats up itself and can provide precise measurements. I am using the slope of the fitted linear to see if there is still significant change and this is how it looks after ~2 hours:

Sometimes it changes quite inexplicably, what I experienced is that it is really sensitive to being moved.
Getting the Gas ppm value
Now we have the resistance of the sensor, are we happy yet? Not so fast.
The value that actually gives us the gas concentrate is Rs/R0 , where Rs is the measured sensor resistance and R0 is the sensor resistance in 1000 ppm LPG gas. Well thanks, everyone has an 1000ppm LPG standard at home right? Fortunately there is other information we can read from the charts in the datasheet:

The light blue line in the Sensitivity Characteristics refers to “Air”. Whatever Air is we can assume that it has no significant amount of CO, neither LPG and we are reading a 10’ish Rs/R0 value. Other tutorials use 9.9 (I guess they are right as the light blue line is not exactly on 10) however seeing how much uncertainty is in this whole measurement setup I find it funny to use 9.9 instead of 10. So we are using 10.
Especially that think for a moment about the sensing resistance range from the datasheet: 2k..20k Ohm and the chart above describes a range larger than 10x. (?!) When looking into an other datasheet for the same device it is stated that 2..20k Ohm. It sounds better, however I don’t know what the remark means – “in 100ppm carbon monoxide” – for the whole range?
Anyway in our case Rs is 8448.34 Ohm and we are measuring it in clean air so the R0 should be around 850 Ohm. Thus the formula to get the Rs/R0 is: 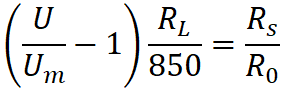 , U is 5V and Rl is 996 Ohms. Everything is ready to get the Rs/R0.
Reading the chart
The next challenge is that we need to read the actual ppm value using the Rs/R0 value and the chart above. Of course we can’t ask our esp8266 to read it visually from the chart so let’s find out something using math. Let’s focus on the CO curve.
First of all we can notice that the chart has log-log scales and the CO curve looks linear. This gives us the tip that the function is something like constant + a * x^b It is actually not too difficult to read the parameters from the chart, take a peek here. One tricky part is that we need to get the x axis value based on the y axis so we should “rotate” the chart. Nevertheless I was lazy so used LabVIEW and Power Fitting to find the parameters. Based on that we are looking at: ![]() where x is the Rs/R0 and y is the actual ppm value for CO.
where x is the Rs/R0 and y is the actual ppm value for CO.
Using the math.h library on an arduino or esp8266 device you have access to the pow() function to calculate the real ppm value. At the same time this can be easily done on the device you are sending the information to so there is no need to take up an arduino’s or esp’s limited resources.
If you want to do everything in one step then 595*pow((5/meas_value-1)*(996/850),-2.24) is the expression that does all the calculation in my case.
The data collection process
After finishing the first version of this post I found a version of the MQ9 datasheet that had a segment about reading cycles and also other pointed out that this is a missing point.
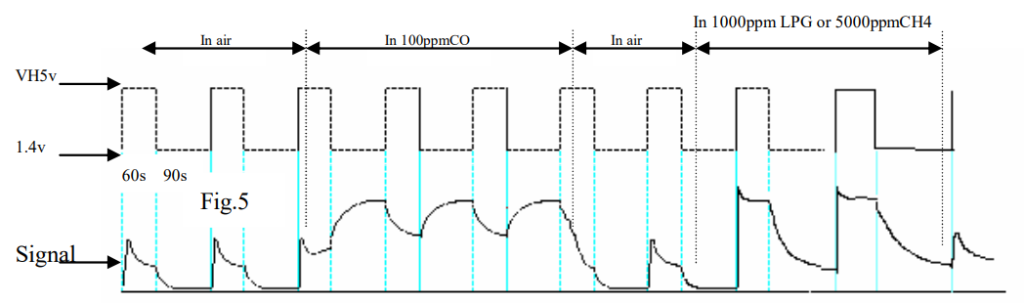
However we have the formula to read the resistance proportion values we are not done yet. These sensors are so called “burn-off” sensors. It means that periods where the sensor accumulates particles on its surface and where the sensor burns-off the collected particles need to change each other continuously to get the proper resistance readings. It can be read from the chart below that the accumulation time should be 90 seconds and the burn-off should be 60 seconds long. During the accumulation 1.4V should be supplied to the heater element and during the burn-off the full 5V.
It would be straightforward to change the voltage level on the Vcc input of the MQ9 board. At the same time don’t forget that this is a voltage divider so by changing the input voltage to 1.4V we also change the input amplitude to the ADC in the ESP8266 that would mean losing almost 2 bits from the no so huge 10 bit ADC resolution.
Looking closer at the MQ9 sensor board we can find a workaround:
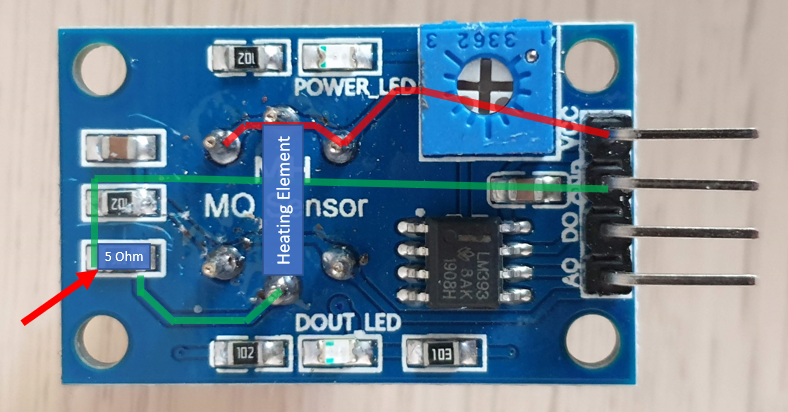
If we remove the 5 Ohm resistor and connect the Heating Element ground side to a custom circuit we can keep the 5V level on the voltage divider with the standard Vcc input and control our Heating Element separately. The simple circuit that needs to be assembled to control the heating element looks like this:

The digital pin to control it can be D5 (pin 14) on the ESP8266 boards as it doesn’t cause issues during the startup process.
I have recorded a waveform with 0.5 sec resolution (each is 100 sample averaging in the ESP8266 with a higher rate) over the serial port and displayed the results (y axis is unscaled analogRead() numbers, x scale is number of samples):

It is visible that around 6000 samples (50 minutes) the waveform amplitude does not change significantly so after a 1 hour warm-up time the sensor should be ready to take measurements.
Response in hazardous gas
To test the modified sensor board I started to look for hazardous gases in my home. Fortunately it was not too easy to get LPG neither CO from any device or pipe. Finally I found a lighter that is operated by gas and could inject some into a plastic bottle. I immersed the sensor into the bottle and did a similar measurement like above. I could not find a clear specification about what is in the lighter gas exactly, however based on many sources it is mainly made of butane. Not exactly propane or methane but it seems that the sensor is still sensitive to it.

- Red graph – measurement value (raw ADC data)
- Green graph – heating element state (On/Off)
The first three periods are in clean air then I submerged the sensor into the bottle. Doesn’t quite look like the graph in the datasheet, however it is visible that the value significantly raises so it should be easy to detect. Also based on the datasheet the CO levels should be detected at the end of the 90 seconds accumulation phase, and LPG levels at the end of the 60 seconds burn-off phase (this information is not consistent though accross datasheets)
Code
To be able to connect this sensor to other systems I have created a KEECO personality that switches the heating voltage periodically (60/90s) and takes a sample (average of 100 samples) right before switching to get a stabilized value. These values are then send in a JSON format alongside with a Warm-Up variable that changes to 1 after having the sensor powered up for one hour. {"WarmedUp":"%d","OnValue":"%d","OffValue":"%d"}
The code can be found here.
In case you want to integrate it with Home Assistant via MQTT this should be added to your configuration.yaml
platform: mqtt
name: MQ9_Warmed Up
state_topic: your_UUID/sensor_input
value_template: "{{ value_json.WarmedUp|int }}"
unit_of_measurement: "Ready"
platform: mqtt
name: MQ9_On Value
state_topic: your_UUID/sensor_input
value_template: "{{ (value_json.OnValue|float)/100 }}"
unit_of_measurement: "V"platform: mqtt
name: MQ9_Off Value
state_topic: your_UUID/sensor_input
value_template: "{{ (value_json.OffValue|float)/100 }}"
unit_of_measurement: "V"
I suggest you do some experiments with your sensor and setup limits accordingly.
Summary
However it was fun to play with this sensor and I will use it in the future too to measure CO in my house, all of the points above just enforce the message that you shouldn’t use this sensor to protect lives:
- Google translate looking datasheets
- Contradicting parameters
- Vague estimations
- Complete lack of proper calibration methodology
- Parameters visually read from a chart
At the end of the day if the read voltage is above a practically defined threshold there might be some problem with gases, or not – that’s what we can state.
I was able to find good advice from your blog, thanks!
Aw, this was a very nice post. In thought I want to put in writing like this moreover ?taking time and actual effort to make an excellent article?but what can I say?I procrastinate alot and on no account seem to get one thing done.